Harmonic analysis is used to determine the steady-state response of a linear structure to loads that vary sinusoidally (harmonically) with time, thus enabling you to verify whether or not your designs will successfully overcome resonance, fatigue, and other harmful effects of forced vibrations.
This analysis technique calculates only the steady-state, forced vibrations of a structure. The transient vibrations, which occur at the beginning of the excitation, are not accounted for in harmonic analysis.
In this analysis, a frequency range is defined beforehand. Within this frequency range, all loads as well as the structure’s response vary sinusoidally at the same frequency. A typical harmonic analysis will calculate the response of the structure to cyclic loads over the frequency range (a sine sweep) and obtain a graph of some response quantity (usually displacements) versus frequency. “Peak” responses are then identified from graphs of response vs. frequency and stresses are then reviewed at those peak frequencies. More information about harmonic analysis can be found in ANSYS help reviewer.

Fig. 1. A disk with a central hole.
In this example, a steel disk with a central hole (see Fig. 1) is analyzed. The radius of the disk is 75mm. The radius of the hole is 3mm. The thickness of the disk is 0.34mm. The disk is simply supported (no translation: UX = UY = UZ = 0) at the edge of the hole. The frequency range of interest is 0~500Hz. Mode superposition method is used in the harmonic analysis. A load with the amplitude being 1N is applied on a keypoint in Z-direction at the edge of the disk. Firstly, a modal analysis is performed. Then all modes between 0 and 500Hz are used. 200 substeps are defined. A damping ratio of 3% is applied. The APDL is attached here (annotations are in lowercase).
FINISH
/CLEAR
/PREP7
ET,1,SHELL181
MP,EX,1,2E5				!unit: MPa
MP,PRXY,1,0.3
MP,DENS,1,7.85E-9		!unit: tonne/mm^3

SECTYPE,1,SHELL
SECDATA,0.34,1,0		!shell thickness=0.34mm
SECOFFSET,MID			!default

PCIRC,75,3,0,360		!creates a circular area centered about the working plane origin

SMRTSIZE,6
ESIZE,5
MSHAPE,0,2D
MSHKEY,0
AMESH,ALL
FINISH

/SOLU
ANTYPE,2				!modal analysis
MODOPT,LANB,50,0,500	!extract 50 modes, frequency range:0~500 Hz
EQSLV,SPAR
MXPAND,50
LUMPM,OFF
PSTRES,OFF

LSEL,S,,,5,8,1
DL,ALL,,UX
DL,ALL,,UY
DL,ALL,,UZ
ALLSEL
SOLVE
SAVE,DISK_MODAL,DB
FINISH

/POST1
SET,LIST
FINISH

/SOLU
ANTYPE,3				!harmonic analysis
HROPT,MSUP,14,1			!mode superposition method, use 14 modes from modal analysis
HROUT,ON,OFF,OFF		!print complex displacements as real and imaginary components (default)
FK,1,FZ,1				!harmonic load amplitude
HARFRQ,0,500			!frequency range
NSUBST,200
KBC,1					!load is step changed
ALPHAD,0
BETAD,0
DMPRAT,0.03				!modal damping ratio=3%
DMPSTR,0
SOLVE
FINISH
SAVE,DISK_HARMONIC,DB

/SOLU
EXPASS,ON
NUMEXP,ALL,0,500,YES	!specifies solutions to be expanded from mode superposition analysis
HREXP,ALL				!specifies the phase angle for the harmonic analysis expansion pass.If ALL, use both 0.0° (real) and 90.0° (imaginary) phase angles
SOLVE

/POST26
*GET,NN,KP,1,ATTR,NODE	!get the node number where the load was applied
NSOL,2,NN,U,Z
LINES,200				!specifies the length of a printed page. Number of lines per page (defaults to 20)
PRCPLX,1				!Stored real and imaginary data are converted to amplitude and phase angle upon output. Data remain stored as real and imaginary parts
/TITLE,disk harmonic analysis-w/linear y-axis (default)
PLVAR,2
PRVAR,2

/GROPT,LOGY,ON
/TITLE,disk harmonic analysis-w/log y-axis to match WB
PLVAR,2
FINISH

/POST1
SET,1,12
PLNSOL,U,Z
PLNSOL,S,1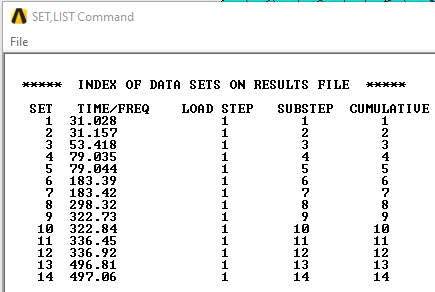
Fig. 2. Natural frequencies.
14 modes are obtained in the frequency range of 0~500Hz.
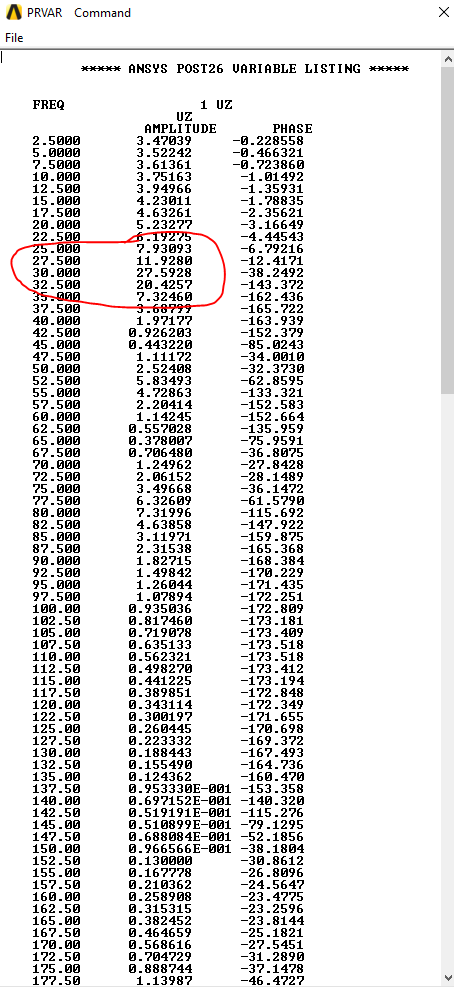
Fig. 3. Print variable 2.
The Z-deformation at the node where the harmonic load is applied is printed in Fig. 3. The maximum amplitude (27.59mm) occurs at 30Hz.
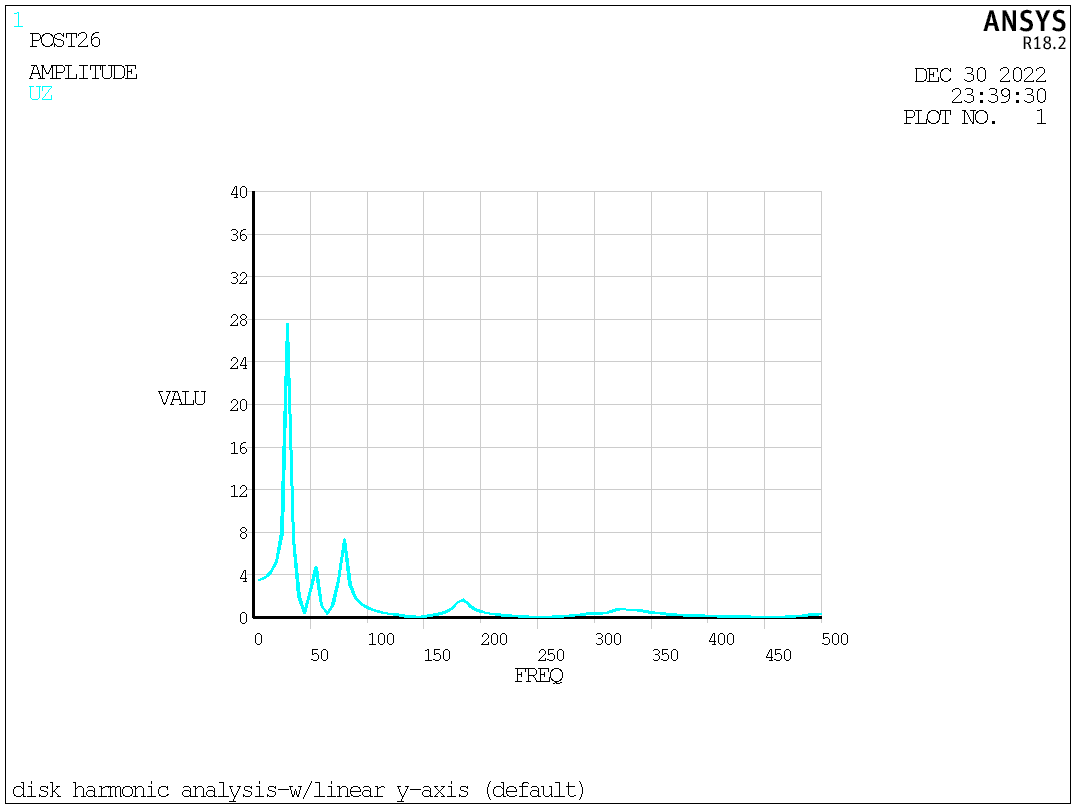
Fig. 4. UZ versus frequency (linear Y-axis).
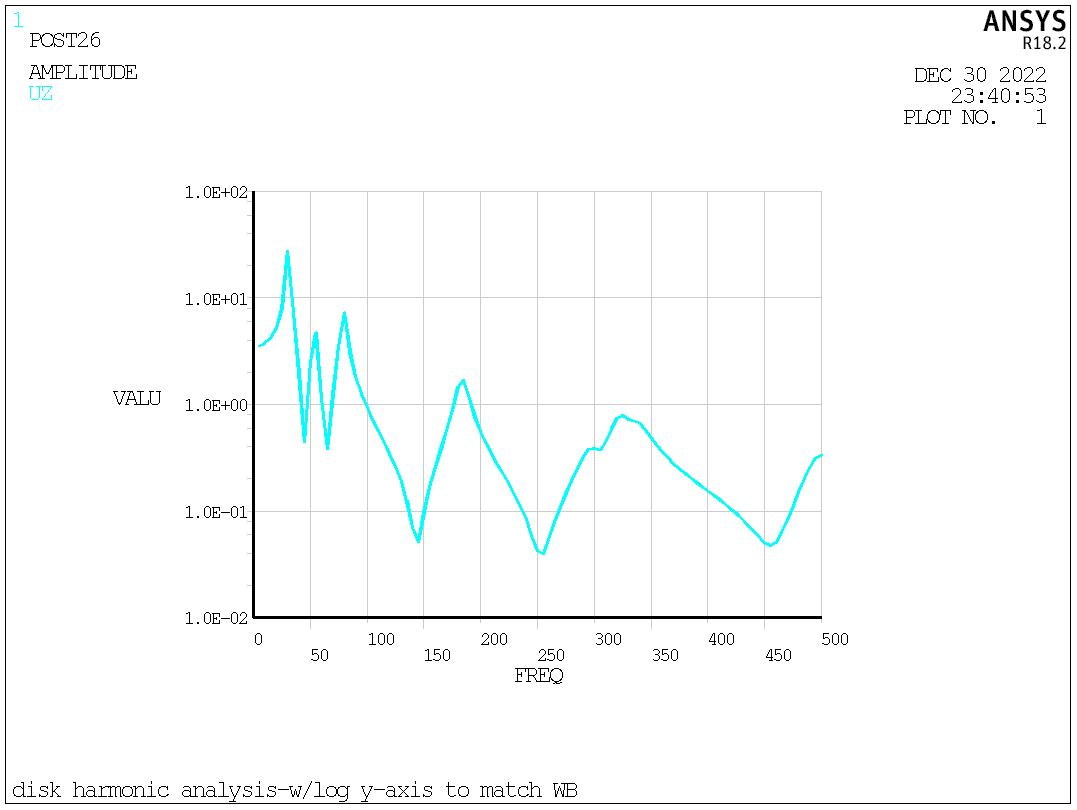
Fig. 5. UZ versus frequency (logarithm Y-axis)
After knowing the peak frequency, displacement and stress at the peak frequency can be reviewed.
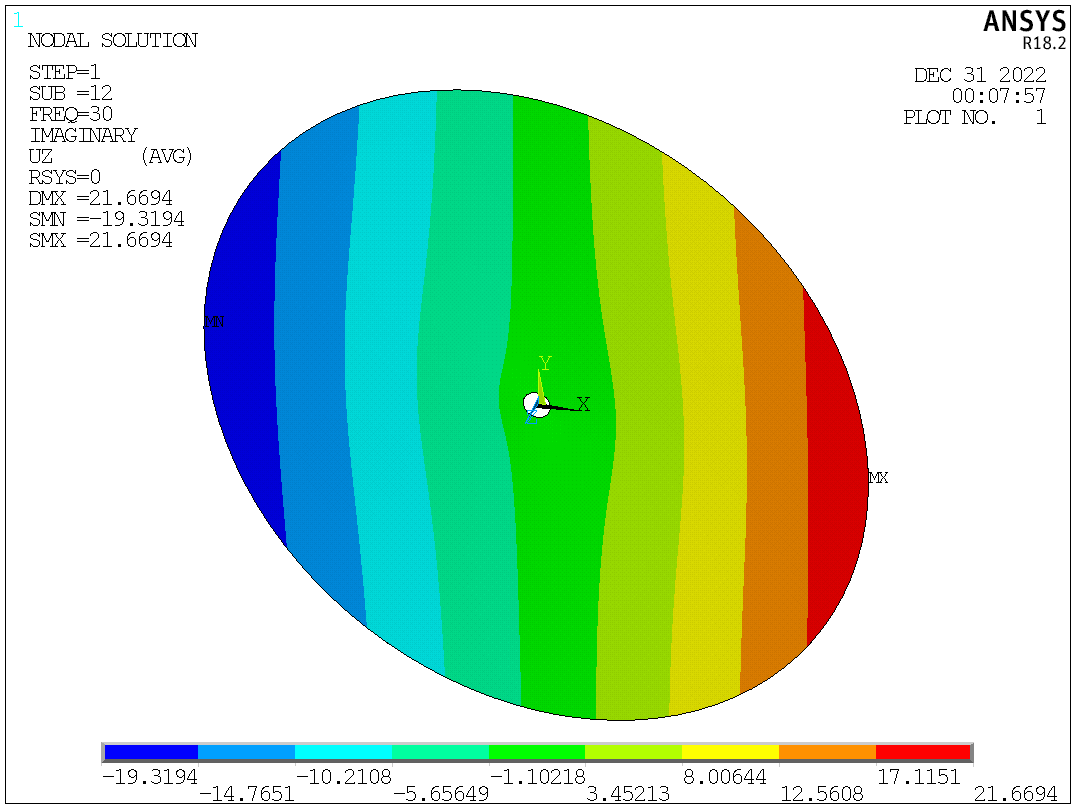
Fig. 6. UZ at 30Hz.
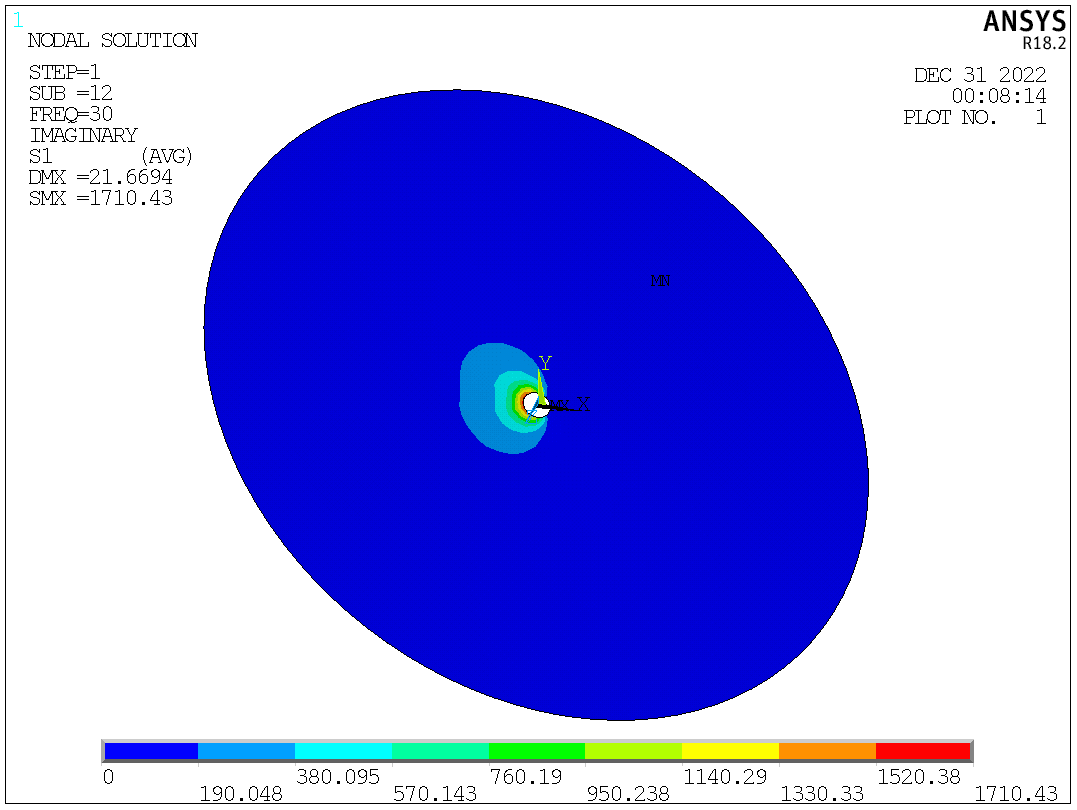
Fig. 7. S1 at 30Hz.
