Here is a report comparing ANSYS Mechanical and SolidWorks Simulation. Simulation is the FEA module in SolidWorks. I was skeptical about Simulation in the beginning, but the results turned out to be good. Compared with ANSYS, it is more user-friendly. The built-in tutorial of Simulation was compiled in such a way that you can easily grasp the concepts of node, element, stress, etc, which I think is extraordinary because many lecturers at Universities may not be able to explain them clearly in plain words. Without further ado, let’s have a look at the report.
FEA Comparison
1 ANSYS
1.1 Model information
The following barrel model is calculated using ANSYS Mechanical APDL. Considering symmetry, only 1/4 of the barrel is modelled. The element size is 4mm. Overall there are 26862 elements.

Figure 1. Meshing.
Table 1 shows how the degrees of freedom are constrained or released at the top and bottom faces.
Table 1. Boundary conditions
| Position | Translation along | Rotation about | ||||
| X axis | Y axis | Z axis | X axis | Y axis | Z axis | |
| Top face | allowed | allowed | allowed | fixed | allowed | fixed |
| Bottom face | allowed | fixed | allowed | fixed | allowed | fixed |
1.2 Stress Results
The result of the 1st principal stress is shown in Figure 2 and Figure 3. The maximum stress is around 59.14MPa. The minimum stress is around 24.90MPa. The maximum stress happens at the 40mm long lip.
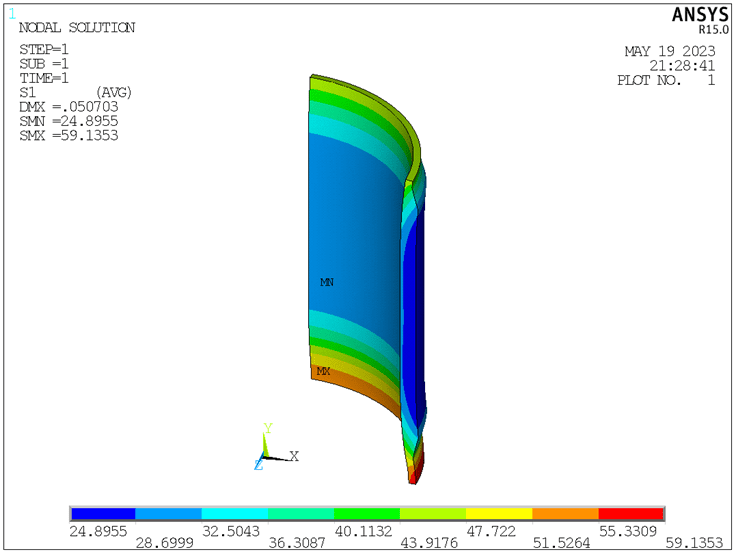
Figure 2. Von-Mises stress (unit: MPa).
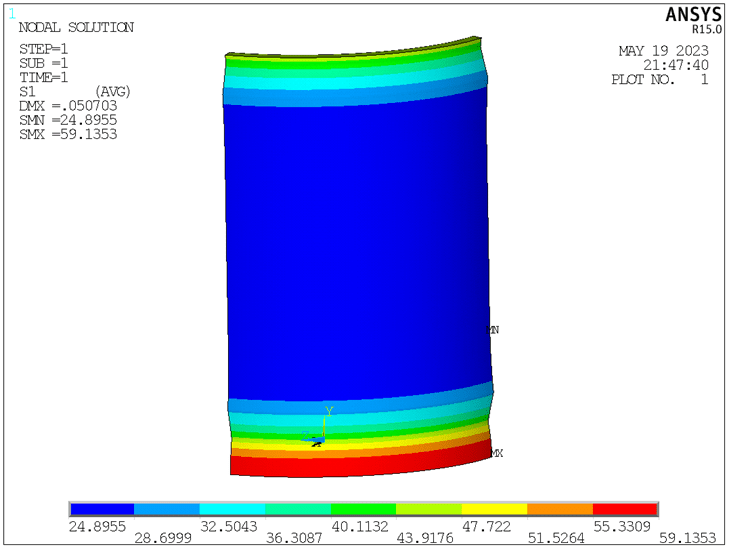
Figure 3. Von-Mises stress (unit: MPa).
1.3 Deformation Results
The displacement result is shown in Figure 4. The maximum displacement is about 0.051mm, happening at the 40mm long lip. The minimum displacement is about 0.025mm.

Figure 4. Displacement (unit: mm).
Figure 5 shows the deformation of the barrel in comparison with its unloaded state. The barrel is slightly compressed axially with expansion in the radial direction, which meets our expectation.
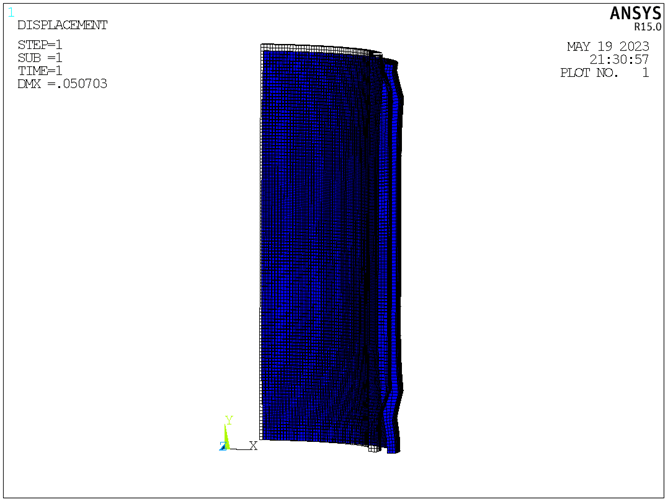
Figure 5. Deformation (wire frame shows the original shape).
Figure 6 shows the displacement along the X axis. From Figure 6, the maximum radial expansion is observed to be 0.051mm.
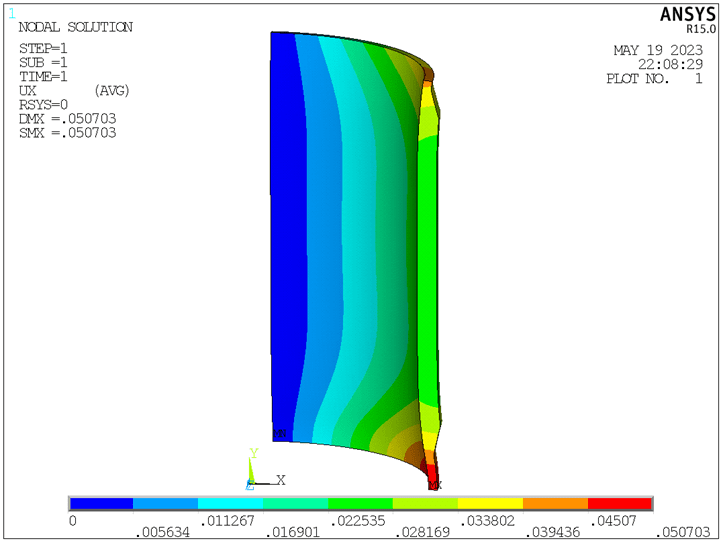
Figure 6. Displacement along X axis (unit: mm).
Figure 7 shows the displacement along the Y axis. From Figure 7, the maximum axial compression is around 0.020mm.
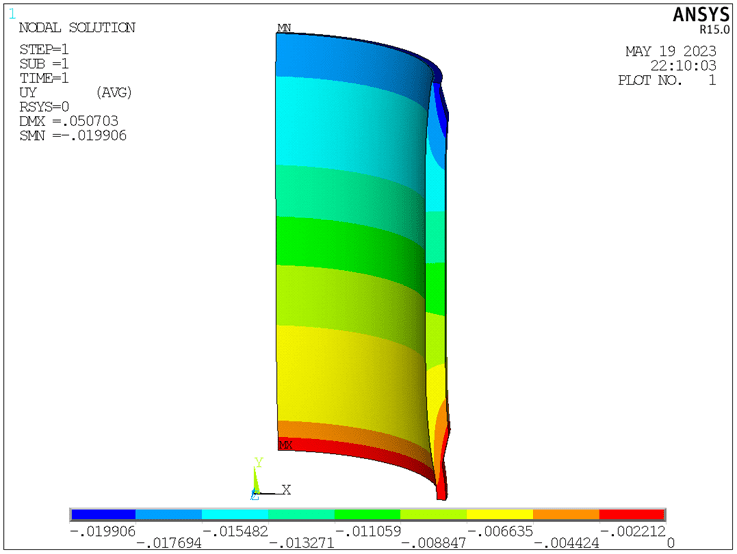
Figure 7. Displacement along Y axis (unit: mm).
2 SOLIDWORKS
For the model in SOLIDWORKS, the finest mesh is applied. Boundary conditions are as follows: on the top face, radial expansion and axial displacement are allowed; on the bottom face, only radial expansion is allowed.
Figure 8 shows the stress results. The deformation agrees with that in ANSYS. The legend is excessively stretched because of the stress singularity at the places where the force and constraints are applied. Figure 9 shows the probed stress results. The maximum stress falls under 53MPa, which happens at the 40mm long lip.
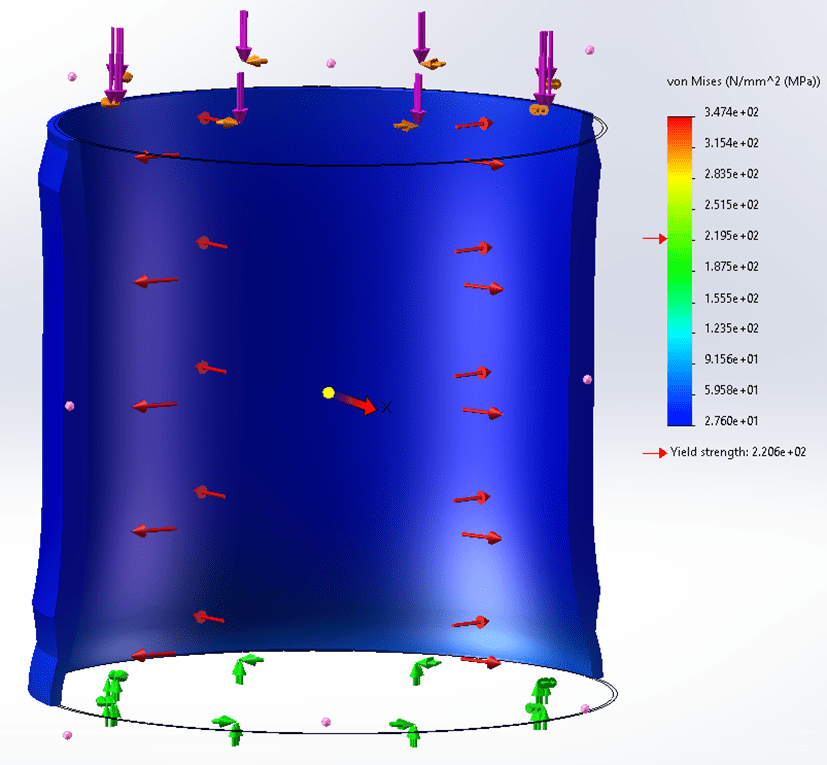
Figure 8. Von-Mises stress.
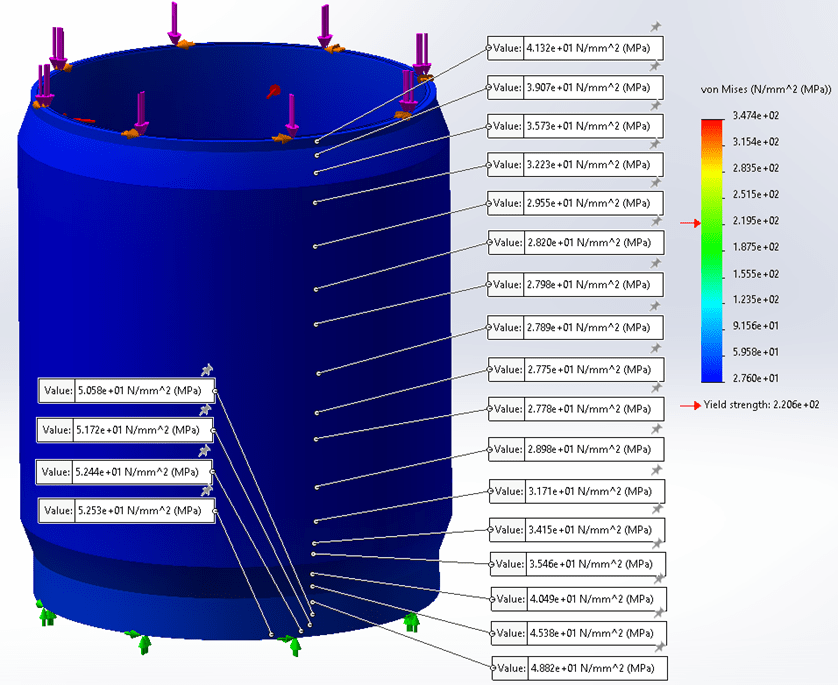
Figure 9. Probed stress results.
Figure 10 shows the displacement results. The maximum displacement, 0.048mm, happens at the 40mm long lip. This value is very close to the result in ANSYS. The maximum axial compression and radial expansion are shown in Figure 11 and Figure 12, respectively, which are also consistent with ANSYS results.
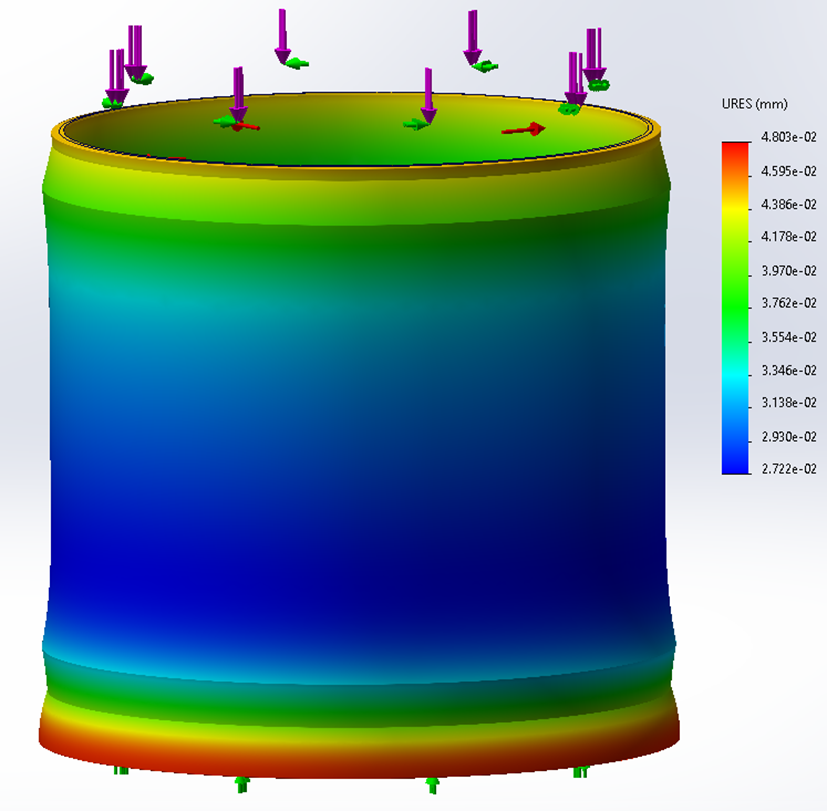
Figure 10. Displacement results (0.048mm maximum).
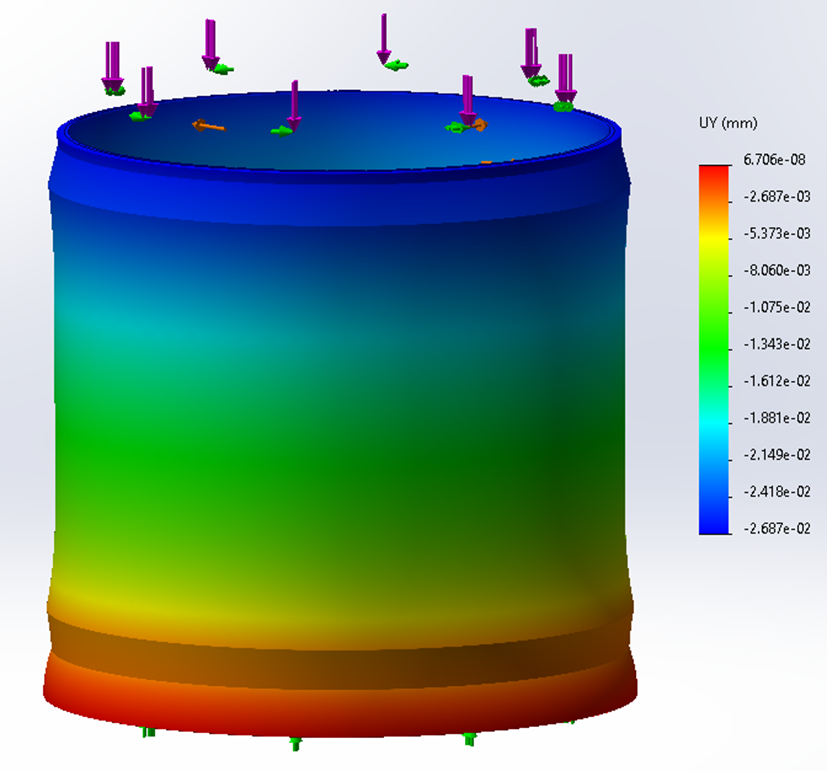
Figure 11. Axial compression (0.027mm maximum).
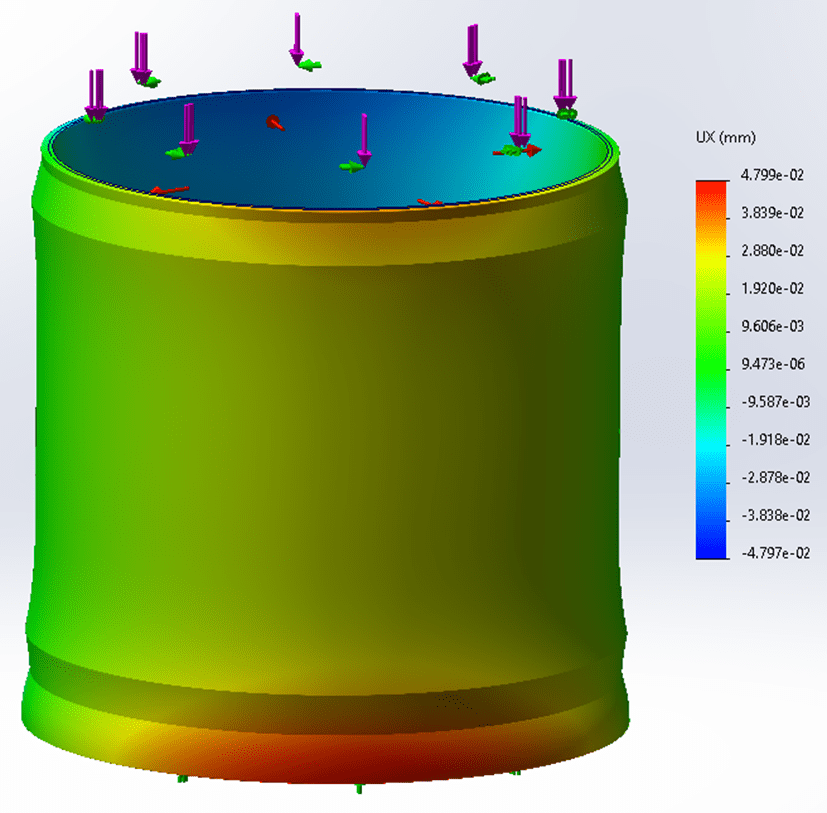
Figure 12. Radial expansion (0.048mm maximum).
3 Comparison
Table 2 shows the comparison of maximum values. Overall, the results agree very well. The difference in displacement is negligible. The difference in stress results could be due to the following reasons:
- Element Types: ANSYS and SOLIDWORKS use different element types for meshing. In ANSYS, the element is 20-node hexahedral solid element. In SOLIDWORKS, the element is tetrahedral with an unknown number of nodes. The difference in elements can affect how stress is calculated and interpolated within the model.
- Meshing: The quality and density of the mesh can significantly impact stress results. If the meshing parameters or techniques differ between ANSYS and SOLIDWORKS, it can lead to variations in stress results.
- Solver Algorithms: The algorithms and numerical techniques employed by ANSYS and SOLIDWORKS for solving the finite element equations may differ. These variations can result in differences in the computed stresses, even if the displacement results are comparable.
- Boundary conditions: Any discrepancies in boundary conditions can affect stress distributions, especially near the applied loads or constrained regions.
Table 2. Result comparison
| Results | (MPa) | Overall (mm) | Axial (mm) | Radial (mm) |
| ANSYS | 59.14 | 0.051 | 0.020 | 0.051 |
| SOLIDWORKS | 52~53 | 0.048 | 0.027 | 0.048 |
From the above study, for elastic analysis, SOLIDWORKS can offer very good modelling results. I assume for nonlinear analysis, it should also perform well but I need to do more research about it. Overall, we should confidently conduct FEA using SOLIDWORKS Simulation.
4 Eigenvalue Buckling Analysis
Eigenvalue buckling analysis predicts the theoretical buckling strength (i.e. the bifurcation point as shown in Figure 10) of an ideal linear elastic structure. This method corresponds to the textbook approach to elastic buckling analysis: for instance, an eigenvalue buckling analysis of a column will match the classical Euler solution. However, imperfections and nonlinearities prevent most real-world structures from achieving their theoretical elastic buckling strength. Thus, eigenvalue buckling analysis often yields unconservative results, and should generally not be used in actual day-to-day engineering analysis [1].
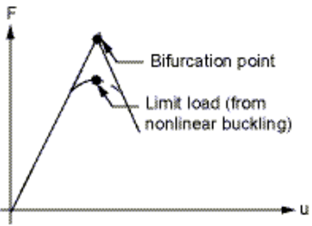
Figure 15. Elastic buckling [1].
From the above static analysis, the maximum stress is much lower than the yield strength (i.e. σ_max<σ_yield). Therefore, there is no need to perform nonlinear analysis that considers large deformation and material plasticity. However, it would be interesting to check the elastic buckling load. Figure 11 shows the first buckling mode. The eigenvalue λ of this buckling mode is 70.0647, which means this elastic buckling would happen when amplifying the present loads by 70.0647 times. Before reaching those loads, the structure would have already failed. In conclusion, because σ_max is much smaller than σ_yield and λ is exceedingly large, for this design, neither elastic buckling nor nonlinear buckling needs to be considered.

Figure 16. Buckling mode shape (the eigenvalue λ=70.0647).
Appendix. APDL Script
The analysis in ANSYS is coded up as follows. New designs can be verified conveniently by changing the geometric parameters in the script and running it in ANSYS.
FINISH
/CLEAR
!units: N, mm, MPa, kg
!define parameters:
OD1=400         !outer diameter 1
OD2=376         !outer diameter 2
ID=355.60       !inner diameter
HEIGHT=476.70   !barrel height
THETA=20        !bulging angle
LIP1=10         !the height of lip 1
LIP2=40         !the height of lip 2
ELASMODU=2.1E5  !Young's modulus, MPa
POSSION=0.28    !Poisson's ratio
RHO=7800E-9     !density
PI=ACOS(-1)
/PREP7
!create geometry:
*AFUN,DEG
K,1,ID/2,0
K,2,OD2/2,0
K,3,OD2/2,LIP2
K,4,OD1/2,LIP2+((OD1-OD2)/2)/TAN(THETA)
K,5,OD1/2,HEIGHT-LIP1-((OD1-OD2)/2)/TAN(THETA)
K,6,OD2/2,HEIGHT-LIP1
K,7,OD2/2,HEIGHT
K,8,ID/2,HEIGHT
A,1,2,3,4,5,6,7,8
K,9,0,0
K,10,0,HEIGHT
VROTAT,1,,,,,,9,10,90,
/VIEW,1,1,2,3
/ANG,1
/AUTO,1
/REP,FAST
!define element type & material properties:
ET,1,SOLID95
MP,EX,1,ELASMODU
MP,PRXY,1,POSSION
MP,DENS,1,RHO
!mesh:
ESIZE,8
VSWEEP,ALL
!define boundary conditions:
NSEL,S,LOC,Z,0
DSYM,SYMM,Z
NSEL,S,LOC,X,0
DSYM,SYMM,X
ASEL,S,LOC,Y,0
DA,ALL,UY,0
DA,ALL,ROTX,0
DA,ALL,ROTZ,0
ASEL,S,LOC,Y,HEIGHT
DA,ALL,ROTX,0
DA,ALL,ROTZ,0
!define loads:
ASEL,S,LOC,Y,0
SFA,ALL,,PRES,88000/(PI*(OD1**2-OD2**2)/4)/4
ASEL,S,LOC,Y,HEIGHT
SFA,ALL,,PRES,88000/(PI*(OD1**2-OD2**2)/4)/4
ASEL,S,,,9
SFA,ALL,,PRES,3.5
ALLSEL
ACEL,,9.8
!solve:
/SOLU
ANTYPE,STATIC
PSTRES,ON
SOLVE
FINISH
!check static solution:
/POST1
PLNSOL,S,1
PLNSOL,U,SUM
PLNSOL,U,X
PLNSOL,U,Y
FINISH
!eigenvalue buckling analysis:
/SOLU
ANTYPE,BUCKLE
BUCOPT,LANB,2
MXPAND,2
OUTRES,ALL,ALL
SOLVE
FINISH
!check buckling mode:
/POST1
SET,LIST
SET,1,1
PLDISP,1
!lambda=70.0647
Reference
[1] ANSYS Documentation-Mechanical APDL-Structural Analysis Guide. Release 15.0 – © SAS IP, Inc.
