It has been a while since the last post. Today I would like to share 4 tips you should keep in mind when doing harmonic analysis using SolidWorks Simulation.
Tip 1. 80% cumulative mass participation criteria
To help determine the minimum number of modes to be used, make sure there is at least 80% mass participation for each direction (in general cases). For some structures, this requirement is more difficult to satisfy, because a sizeable portion of the system mass is connected to high modes. This is typical for in-plane directions of large sheet components. Because these high frequency modes are not always required for conventional dynamic problems, lower than 80% values for cumulative mass participation is sometimes acceptable.

Tip 2. Verify mesh is sufficient to describe the highest mode
Plot the mode shape of the highest mode and see if the mesh can plot the shape well.
Tip 3. Highest natural frequency Vs. the operating frequency
![]()
As in transient vibration analysis, the highest natural frequency of the model should be well above the highest frequency of the load.
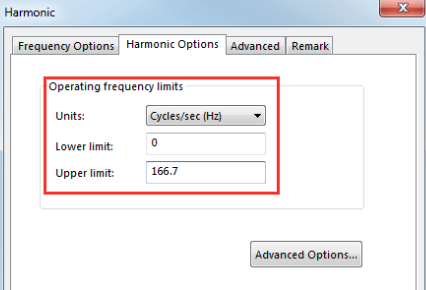
Tip 4. Harmonic options & advanced options
Specify the units and limits of the operating frequency of the load.
Because harmonic simulation is solved at a discrete number of frequency points. Density and distribution of these solutions points is controlled in the Advanced Options.

Let’s see a hypothetical solution over the operating frequency range.

It will feature valleys and distinct peaks with the maximum of the response amplitudes. Distinct harmonic study will therefore always solve for the solution where the operating frequency coincides with the natural frequencies. These are potentially critical locations where a resonance may occur.
To obtain smooth amplitude response function, simulation study solves for the solution at additional point within each frequency band. No. of points for each frequency controls how many additional points a simulation will solve and Bandwidth around each frequency controls the width of the bandwidth. The default values are typically okay for most conventional problems.
Interpolation controls the distribution of the additional solution points within the frequency band. Logarithmic setting pushes more points towards the natural frequency location. This is the default setting because more points around the natural frequency location implies better resolution of the peak responses. Linear setting spaces the additional solutions points evenly.

Pingback: SolidWorks Simulation: How Do We Understand Response Spectrum Analysis? | Xutao Sun