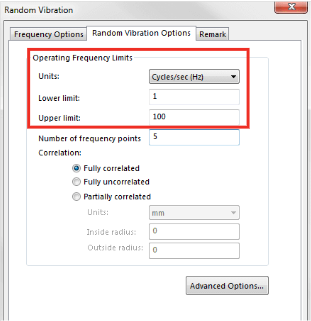
Operating Frequency Limits specify the range of the load considered in the simulation.
Number of frequency points has the same function in random vibration analysis as in the harmonic study. The solution from the random vibration study for any quantity will feature valleys and distinct peaks with the maximums of the response amplitudes. Random vibration study will therefore always solve for the solution where the operating frequency coincides with the natural frequencies. These are potentially critical locations where a resonance may occur. To obtain a smooth amplitude response function, the simulation solves for the solution at the additional points within each frequency band. The number of these additional points is controlled by this parameter.
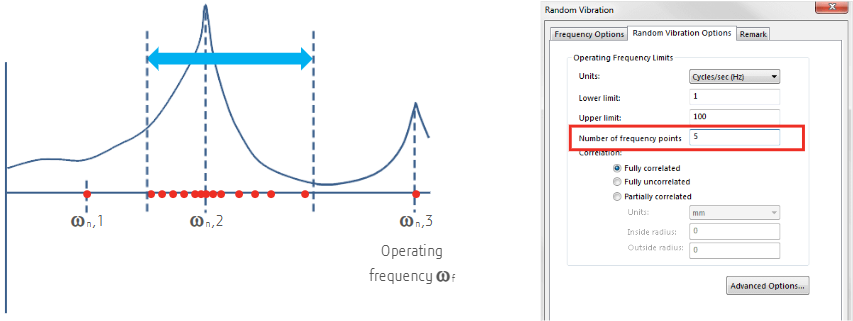
Increasing Number of frequency points will make the calculation time longer, but will also provide a smoother solution. A smooth solution is important for the accurate integration of the resulting PSD curve in order to obtain accurate RMS values.
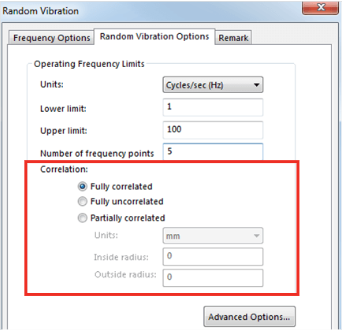
Correlation defines how much correlation between the nodes of the finite element model is required during the solution process. It is recommended that the Fully correlated option is always used. The Fully uncorrelated option should only be used if the system lacks sufficient computation power. The Partially correlated option is not used frequently.
The Advanced tab controls the solution Method, Gauss integration order, Biasing parameter, and Cross-mode cut-off ratio.
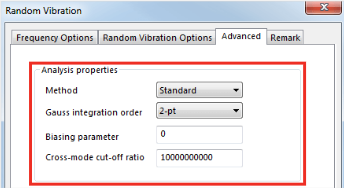
Two methods for the solution are available:
- Standard, where full random vibration solution is performed. This is the default selection and should always be used.
- Approximate, which assumes that the PSD of the exciting quantity is locally constant. This option should only be used if the system lacks sufficient power and the input PSD resembles the white noise locally.
Gauss integration order controls the order of the numerical integration required to integrate the output PSD curve in order to obtain the RMS of the resulting quantity. Default value of 2 is suitable for most of the solutions. If higher accuracy is required, set this option to 3.
Biasing parameter defines how the frequency points specified in the Number of frequency points option are spaced. A value of 1 ensures evenly distributed data; any value larger than 1 pushes points toward the natural frequency data locations at the center of the band. The typical value for this parameter is 2.
Cross-mode cut-off ratio controls interaction between highly spaced modes.
